
Big Data in Psychology: Tweets, Work and Stress

Assistant Professor of Industrial/Organizational Psychology, Wei Wang, Ph.D., was the lead big data researcher on a recently published paper entitled “Twitter Analysis: Studying U.S. Weekly Trends in Work Stress and Emotion.”
According to Center for Disease Control and Prevention and previous research, in the United States, more than 70% of workers report that their jobs are stressful, which is one of the major causes of cardiovascular disease that affects one third (83 million) of U.S. adults and costs America $444 billion annually.
In their project, Dr. Wang and his colleagues utilized big data techniques and conducted Twitter analysis as a novel approach to studying work stress and happiness, through which they examined the work recovery effect of weekends by using the Effort-Recovery Model.
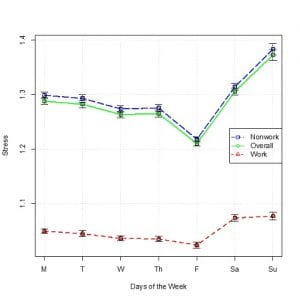
Figure 1. Percentage of Tweet Words about Stress, by Day of the Week.
The Effort-Recovery model theorizes that effort expended at work leads to stress-related reactions, which in turn lead to higher, after-work stressor levels. In order to maintain healthy conditions, recovery needs to be completed before a subsequent work load starts. One of the important opportunities for such recovery is weekends.
To examine the Effort-Recovery Model, Dr. Wang and his research team retrieved and analyzed over 2 billions of Tweets from about 47 millions of unique Twitter users. They text analyzed these Tweets by using the Linguistic Inquiry and Word Count Technique across a time period of 512 days. They also developed their own text dictionary to assess stress on Twitter and in other texts.
Their research revealed that the trends of stress on Twitter over the days of the week were very similar and showed a clear Friday dip effect: stress and negative emotion words on Twitter started with higher percentage frequencies on Mondays and slowly decreased from Mondays to Thursdays, and dipped on Fridays.
However, instead of continually decreasing as they expected, the work stress and negative emotions gradually increased on Saturdays and peaked on Sundays.
In contrast, happiness on Twitter was the lowest in the midweek (i.e., Tuesdays, Wednesdays, and Thursdays), and then gradually increased through the weekend (Fridays through Sundays), which supported their expectations from the Effort-Recovery model.
Besides work stress and happiness, their team also text-analyzed health issue related words (e.g., ache*, itch*, pain, sick, drug, etc.) on Twitter, which showed a different trend than the trends for stress and happiness.
Interestingly, Dr. Wang explained, these trends representing the word frequency were not influenced by the number of Tweets that people posted on different weekdays, people actually Tweet less words on weekends, which suggests that people are more emotionally expressive on weekends.
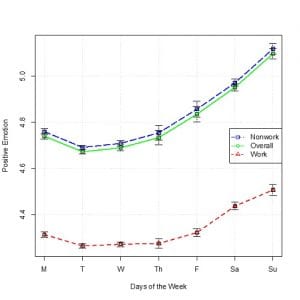
Figure 2. Percentage of Tweet Words about Happiness, by Day of the Week.
Detecting and identifying work vs. non-work Tweets or messages can better inform work and organizational health research. Big data approaches like Twitter analysis show exciting potential for health research, and their application in workplace and organizational research is promising.
Dr. Wang hopes that this paper will bring attention to the applications of big data and computational techniques to social sciences. His Computational Psychology Laboratory is currently bringing this new approach to the health management and engineering team research, by collaborating with the College of Health and Public Affairs and the College of Engineering.